What Americans Are Drinking Instead of Alcohol: The 2026 Data

Updated: Sep 26
Yesterday, August 20th, 2026, Gallup reported that 54% of US adults drink alcohol, tying last year's record low in a trend line that goes back roughly 90 years. Five weeks earlier, IWSR told its clients that Gen Z drinking participation is climbing and that Boomers, not twenty-somethings, are the cohort pulling volume down.
Both findings are correct. Most of the coverage you will read this month reconciles them badly, because it starts from the assumption that drinkers are trading one liquid for another. The 2026 data says something more complicated, and more useful if you buy, build, or sell beverages for a living.
This piece walks through what US consumers are actually reaching for instead of alcohol, how big each of those categories really is, how much of the lost alcohol occasion is being captured versus simply erased, and what the credible forecasts say about the next five years. Every figure is attributed to a named source with a date. Where the sources disagree, that disagreement is shown rather than smoothed over.

The replacement question at a glance
Alcohol participation has stopped falling, but volume has not. Gallup's drinking rate held at 54% for a second year, while IWSR put US total beverage alcohol volume down 5% in 2025, with 49 of 50 states declining.
The Gen Z story is wrong in its popular form. Gallup's three-year drop was 8 points among 18 to 34s and 8 points among 35 to 54s. IWSR's panel shows Boomers as the lowest-participating generation at 71%.
Non-alcoholic beer, wine and spirits crossed $1 billion in US off-premise sales, and the growth rate is decelerating from roughly 35% to roughly 20%.
Hemp-derived THC beverages hit $239 million in measured retail, up 135%, with liquor stores as the single largest channel. Federal law could remove most of that inventory within months.
The largest substitute is an ordinary soft drink. Among Dry January participants, soft drinks and hot drinks were named three to four times as often as any alcohol-free analogue, and about one in ten simply skipped the on-premise visit.
Affordability is among the leading stated reasons for cutting back, which means some share of this reverses when household budgets do.
The number of people drinking is not changing. Instead, we're finding that more people are drinking less often, and enjoying fewer drinks when they do. Marten Lodewijks, President & Managing Director, IWSR
Part 1: The demand-side reset in hard numbers
Start with the participation data, because it sets the ceiling on everything else.
Gallup's 2026 Consumption Habits survey, fielded July 1 to 19 with 1,200 adults, found 54% of US adults saying they drink. The trend runs 62% in 2023, 58% in 2024, 54% in 2025, and 54% again this year. Drinkers reported an average of 3.2 drinks in the past week. Just 13% said they sometimes drink more than they should, a record low in a series Gallup has run since 1985, which peaked at 35% in 1989. Roughly half, 51%, said one or two drinks a day is bad for your health, up from 27% in 2001 and 39% in 2023, though statistically unchanged from last year's record high of 53%.
Volume tells a harsher story than participation. IWSR reported US total beverage alcohol volume down 5% in 2025, with beer down 6%, wine down 6%, spirits down 4% and RTDs down 1%. Forty-nine of fifty states declined, Nevada being the lone exception. The Beer Institute's taxable removals series, derived from TTB data, put 2025 domestic beer shipments at 139.1 million barrels, down 5.9%, a loss of roughly 8.7 million barrels in a single year.
Two things in that data are widely misread.
First, the premium end of the shelf has inverted. WSWA's SipSource depletion data for the twelve months ending March 2026 showed spirits priced above $100 down 9.3% in volume and the $50 to $99.99 tier down 8.8%, while everything under $50 fell between 4.2% and 5.6%. The expensive end is falling roughly twice as fast as the value end. In tequila, the $20 to $29.99 band grew 3.3% while the $100-plus tier fell 16.5%.

Premiumization has inverted. US tequila volume change by retail price band, twelve months to March 2026. Source: WSWA SipSource via The Spirits Business, 22 May 2026.
Second, spirits volume and spirits revenue are moving in opposite directions. The Distilled Spirits Council's February 2026 briefing put 2025 US supplier revenue at $36.4 billion, down 2.2%, on volume of 318.1 million nine-litre cases, up 1.9%. That volume gain is an artifact of low-ABV, high-liquid spirits-based RTDs, which grew 16.4% to $3.8 billion. Cases are not ethanol. If you are reading a headline that says spirits volume grew last year, check what it is counting.

Only the alternatives grew. Volume change in 2025 versus 2024. Source: IWSR, 11 May 2026.
Table 1: The 2025 US category scoreboard
Category | Volume | Value / revenue | Source |
Total beverage alcohol | −5% | n/a | IWSR, May 2026 |
Beer (domestic shipments) | −5.9% | n/a | Beer Institute, February 2026 |
Wine | −6% | −4.6% (T12M to Jun 2026) | IWSR; WSWA SipSource |
Spirits | −4% (IWSR) / +1.9% cases (DISCUS) | −2.2% supplier revenue | IWSR; DISCUS, February 2026 |
Spirits-based RTDs | +14% | +16.4% | IWSR; DISCUS |
No-alcohol beer | +15% | n/a | IWSR, May 2026 |
Hemp-derived THC beverages | n/a | +135% dollars, measured retail | NIQ, T12M to June 2026 |
One more channel note that cuts against the standard explanation. SipSource data for the twelve months to June 2026 shows on-premise wine and spirits volume down 2.5% while off-premise volume fell 7.3%. The bar is holding up roughly three times better than the retail shelf. "People stopped going out" does not survive contact with that number. What appears to be happening is that the at-home, mid-week, habitual drink is the occasion being deleted, while the deliberate night out survives at a smaller check.
For a worked example of a single occasion cutting against the trend line, see our analysis of World Cup 2026 alcohol sales.
Part 2: Correcting on: who stopped drinking
The most repeated claim in this category is that Gen Z killed drinking. The 2026 evidence does not support it in that form.
Gallup's own age breaks show the decline is broad. Between 2023 and 2026, the drinking rate fell 8 points among 18 to 34s, 8 points among 35 to 54s, and 6 points among adults 55 and over. The middle-aged cohort fell exactly as fast as the young one.
IWSR's Bevtrac panel goes further. Its July 14, 2026 release, drawn from more than 32,000 respondents across 19 markets in the first half of 2026, put Gen Z legal-drinking-age participation at 74% across 15 markets, up from 66% three years earlier, and US Gen Z participation at 71%, up from 68%. Millennials sit highest at 81%, Gen X at 77%, and Boomers lowest at 71%, down 2 points, averaging 2.6 drinks per occasion. IWSR President Marten Lodewijks put it bluntly: "The narrative that Gen Z is the generation of moderation is now conclusively debunked."

The decline is not a Gen Z story. Share of US adults who say they drink alcohol. Source: Gallup Consumption Habits survey, 20 August 2026.
Table 2: Two datasets, two questions, one shared conclusion
Cohort | Gallup 2026 (% of US adults who drink) | IWSR Bevtrac H1 2026 (% of LDA+ who consumed a category recently, 15 markets) |
18 to 34 / Gen Z | 50% | 74% (US Gen Z: 71%) |
35 to 54 / Millennial | 58% | 81% |
Gen X | n/a (folded into bands) | 77% |
55+ / Boomer | 55% | 71% |
All adults | 54% | 76% (US: 70%) |
These are not the same measurement. Gallup asks US adults whether they ever drink; IWSR asks legal-drinking-age consumers in 15 countries whether they consumed specific categories recently. Do not merge them into one number. What they agree on is the part that matters commercially: frequency and intensity are falling faster than participation. IWSR's average drinks per occasion dropped from 4.4 in 2024 to 2025 to 3.9 in the first half of 2026. The customer is still walking in. They are buying less per trip.
For a deeper read on the generational data, see our earlier analysis, Gen Z and Alcohol: What the Data Really Shows in 2026.

Zero-proof drinks are the visible half of the story. The bigger half is far more ordinary.
Part 3: What people are actually reaching for
Ranked by how much of the vacated alcohol occasion each one absorbs, from largest to smallest:
Ordinary soft drinks, coffee, tea and water
Non-alcoholic beer, wine and spirits
Functional and "alcohol-adjacent" beverages
Hemp-derived THC beverages
Cannabis in non-beverage form, and pharmaceutical appetite suppression
Nothing at all
That order surprises people who follow the trade press, where the ranking is usually reversed. Here is the evidence for each.
Tier 1: The boring winner
CGA by NIQ surveyed US on-premise consumers about Dry January 2026 and asked participants what they ordered instead. Soft drinks came in at 57%, hot and iced drinks at 41%, sparkling water at 29%. Mocktails took 15%, alcohol-free beer 13%, alcohol-free wine 12%, alcohol-free spirits 11%. Numerator's household panel found a nearly identical hierarchy: coffee and tea at 43%, still water at 33%, sparkling water and soda at 30% each, juice at 25%.
Legacy non-alcoholic drinks were named several times more often than any purpose-built zero-proof product: 57% and 41% against 13%, 12% and 11%. These are multi-select responses, so treat the ratio as directional rather than exact. About one in ten Dry January participants told CGA they planned to skip the on-premise visit entirely, which is the cleanest available measure of occasions that are deleted rather than transferred.

What people actually order instead. US on-premise consumers during Dry January 2026. Source: CGA by NIQ, 13 January 2026.
Tier 2: Non-alcoholic beer, wine and spirits
This is the category with the most momentum and the most inflated expectations.
NIQ confirmed that US off-premise non-alcoholic beer, wine and spirits surpassed $1 billion in the 52 weeks ending January 3, 2026, up from $925 million and 22% growth as of August 2025. Brewbound reported the adult non-alcoholic category passing $1.08 billion in 2026, with growth "slowing as the category matures."
Beer carries the category. Circana scan data put NA beer at $632.4 million in the 52 weeks ending April 19, 2026, up 22.0% in dollars and 23.7% in cases, sitting at roughly 1.3% of the total beer market in scanned off-premise channels. The Brewers Association's State of Non-Alc report, using NIQ all-channel data, puts NA at 2.5% of beer volume in 2025, up from 1.1% in 2021, with volume up 111% and dollars up 159% over that span. Both numbers are right; they measure different universes. If you quote one, state the basis.
Assortment has exploded alongside it: 484 NA brands from 213 producing companies in 2025, up from 173 brands and 91 companies in 2021.
The important caveat is the growth curve. Industry analysts tracking the category describe the trajectory stepping down from roughly 35% annual growth, to 30% and 25%, to about 20% now. S&D Insights' Brian Sudano framed the bear case directly: despite expanded spend and distribution in 2025, the category "only grew 20%." NIQ's Kaleigh Theriault holds the bull case, expecting continued double-digit growth. Both are consistent with a category that is real, permanent, and no longer exponential.

Beer carries the non-alcoholic category: roughly 80% of US zero-proof sales.
Tier 3: Functional and alcohol-adjacent
IWSR now separates "no-alcohol analogues," meaning products that imitate beer, wine or spirits, from "alcohol adjacents," meaning functional, nootropic, adaptogenic and hemp-CBD drinks that make no attempt to taste like alcohol. In its January 22, 2026 release, alcohol adjacents grew 11% in volume in 2025 and no-alcohol analogues grew 9%.
The motivational split inside that data is the single most actionable finding for merchandising. Among alcohol-adjacent buyers, only 26% cite health, against 37% for NA beer buyers and 40% for NA wine and spirits buyers. Twenty percent were simply curious, and 17% wanted the effect of the functional ingredient. The US over-indexes hard here: 33% of US no-alcohol drinkers consumed an alcohol-adjacent product, against 19% across the top ten markets.
Read plainly, this means functional drinks are frequently an incremental purchase rather than a swap. They compete with novelty and with mood, not with the beer set.
The adjacent categories worth watching, with the caveat that none of them market themselves as alcohol replacements:
Modern soda. Circana put the segment at $1.8 billion, up 83% year over year, as of its May 2025 read. PepsiCo closed its acquisition of Poppi on May 19, 2025 at a $1.95 billion gross price. Olipop raised at a $1.85 billion valuation in February 2025 on roughly $400 million in 2024 sales. Beverage-Digest reported in August 2026 that Poppi's US retail sales fell in the first half of 2026 while Olipop decelerated, so this segment is normalizing too.
Energy. Circana had US energy drinks at $28.1 billion, up 15.2%, for the 52 weeks ending April 19, 2026. Mintel reports that 33% of energy drinkers aged 22 and over consider energy drinks a good alternative to alcohol. That is the strongest published evidence of energy encroaching on the alcohol occasion, and it is a stated attitude rather than measured behavior.
Kava and kratom. Growing, and a genuine compliance exposure. CDC's MMWR reported 3,434 kratom-related US poison center reports in 2025, the highest on record and roughly 1,200% above the 258 reported in 2015, and 233 kratom-related deaths from 2015 to 2025. DEA filed notices of intent on July 1, 2026 to temporarily place 7-OH above a specified threshold, plus three related substances, into Schedule I. Botanical kratom below that threshold is not covered. There is no credible independent market sizing for these products. If your accounts are stocking them, treat staff education as a risk-control measure, not a merchandising nicety.
If you are building a set or a training plan around this tier, we covered the mechanics in how to sell functional beverages.
Tier 4: Hemp-derived THC beverages
The fastest-growing thing in a liquor store, and the least stable.
NIQ measured $239 million in THC beverage dollar sales, up 135%, in mainstream scanned retail for the 52 weeks ending June 27, 2026. Liquor stores were the largest channel at $132 million, ahead of convenience at $55 million and grocery at $49 million. Ten-milligram products accounted for 51% of category dollars. Brightfield Group, which estimates total sell-through including smoke shops and direct-to-consumer, put hemp-derived THC beverages at roughly $1.1 billion in 2025, up from $630 million in 2024.
Substitution evidence here is stronger than in any other tier. Brightfield found 47.8% of THC drink consumers who also drink alcohol reported drinking less alcohol, with hangover avoidance cited by 40.9%. A peer-reviewed study by Kruger and colleagues in the Journal of Psychoactive Drugs (2026) found self-reported weekly drinks falling from 7.02 to 3.35 among cannabis beverage users, though the sample was 438 people, self-selected and retrospective.
The counterweight belongs in the same paragraph. Calvert and Erickson's 2021 analysis in the Journal of Cannabis Research, using a Nielsen panel of 69,761 households across all 50 states from 2004 to 2017, found alcohol down 13% in Colorado after legalization but spirits up 24% in Washington (unrestricted sample; the 69,761-household restricted sample showed 18%). Their conclusion: alcohol and cannabis "are not clearly substitutes nor complements to one another."
And then there is the law. Section 781 of Public Law 119-37, signed November 12, 2025, redefines hemp to cap finished hemp-derived cannabinoid products at 0.4 milligrams of total THC per container, roughly 25 times below a standard 10 mg can. The US Hemp Roundtable estimates, in analysis cited by Vicente LLP, that the provision would make about 95% of existing hemp-derived cannabinoid products federally unlawful. The default effective date is November 12, 2026.
On August 8, 2026, the Senate passed a continuing resolution containing a partial delay to December 11, 2026, tabling an amendment to strip it by 61 to 32. As of this writing the House has not acted and the delay is not law. Note also that the delay, if enacted, is partial: cannabinoids not capable of being naturally produced by the plant lose hemp status on November 12 regardless.
If you sell these products, this is a live inventory and compliance question, not a 2027 problem. We are tracking it in the November 2026 hemp THC ban, and Hemp Bev Certified exists to get floor staff to a defensible standard on dosing, age-gating and state rules. Bar and restaurant teams now have their own track, Hemp Bev Certified for On-Premise, and all three editions are compared side by side at hempbevcertified.com.
Tier 5: Cannabis and pharmacology
Two forces sit outside the beverage aisle entirely and still move volume.
Federal NSDUH data reported in July 2026 counted 21.4 million daily or near-daily marijuana users aged 12 and over, against 17.2 million daily or near-daily alcohol users. Daily cannabis use now exceeds both daily drinking and daily cigarette smoking. Carnegie Mellon's Jonathan Caulkins first documented the crossover in Addiction in 2024 using 27 surveys and more than 1.6 million respondents.
GLP-1 medications are the newer variable. Gallup's July 2026 reading put current GLP-1 use for weight loss at 11% of US adults, up from 8% in 2025 and 3% in 2024. KFF put use for any indication at 12% as of November 2025. On the clinical side, a Lancet trial published in spring 2026 (Klausen et al., 108 adults with alcohol use disorder and obesity over 26 weeks) found a 41.1% reduction in heavy drinking days on semaglutide plus CBT, 13.7 percentage points better than placebo, corroborated by blood biomarkers.
Be careful extrapolating that. Both major trials studied clinical AUD populations, not general drinkers. The most-cited market model remains Bernstein's 2024 estimate of a 2% reduction in US per-capita alcohol consumption by 2030 in the worst GLP-1 case, which is now more than two years old.
Table 3: The substitution matrix
Category | 2025–26 growth | Primary buyer motivation | Substitution evidence | Where it belongs |
Soft drinks, coffee, water | Flat to low single digit | Default, availability | Strongest by volume of occasions | Already everywhere |
NA beer | +22% dollars (Circana) | Health (37%) | 92% of buyers still buy alcohol | Cold box, adjacent to craft |
NA wine and spirits | NA spirits growing fastest off a small base | Health (40%) | Lowest trial rate of the analogues | Endcap, cocktail set |
Functional / adjacent | +11% volume (IWSR) | Curiosity (20%), effect (17%), health (26%) | Largely incremental | Own set, not the beer wall |
Hemp THC beverages | +135% dollars (NIQ) | Effect, hangover avoidance | Strongest per-user substitution signal, but from small self-reported samples | Regulated set, age-gated, legally exposed |
Cannabis (non-beverage) | 21.4M daily users | Effect | Mixed academic evidence | Outside the three-tier system |
Part 4: The uncomfortable finding
Put the substitution evidence together and a ceiling appears.
Gallup found that 17% of US adults have consumed non-alcoholic beer, wine or spirits instead of an alcoholic drink at any point in the past year. That is the total addressable substitution behavior, once a year, self-reported. NIQ found that 92% of non-alcohol buyers also purchase alcohol, a figure the Brewers Association's State of Non-Alc report echoes, citing the Adult Non-Alcoholic Beverage Association at "more than 90%." NIQ describes non-alcohol as complementary to alcohol rather than replacing it. IWSR's motivational data says the same thing from a different angle.
Meanwhile, Datassential's January 2026 work found more than two-thirds of drinkers agreeing that alcohol has become noticeably more expensive, and more than a third of those drinking less in 2026 naming higher prices as a key reason. Separately, nearly a third of drinkers said there is room for more mindfulness and moderation in how they consume. Note that these are two different questions on two different bases, so they cannot be ranked against each other. What the data does support is that affordability is one of the two or three leading stated drivers, sitting alongside health rather than behind it.
That combination points to a conclusion the category narrative tends to skip: a meaningful share of the lost volume has not moved to another shelf. It has been deleted from the basket for economic reasons, and it may come back. IWSR's Marten Lodewijks framed it more precisely than most trade coverage does: "the number of people drinking is not changing. Instead, we're finding that more people are drinking less often, and enjoying fewer drinks when they do."
Only 17% of US adults have used a non-alcoholic beer, wine or spirit in place of a drink in the past year, and 92% of non-alcohol buyers still buy alcohol. Gallup, August 2026; NIQ, August 2025
Gallup, August 2026; NIQ, August 2025
Part 5: Predictive analysis, 2026 to 2035
Here are the credible published forecasts, and what they imply when you line them up.
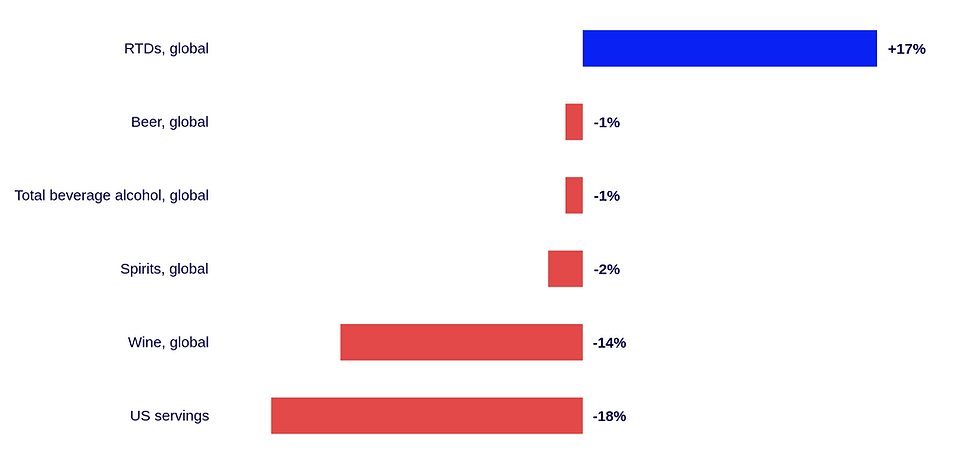
Where the volume goes over the next decade. Cumulative change 2025 to 2035. Source: IWSR, 11 June 2026.
Table 4: What the forecasters actually project
Source | Date | Scope | Projection |
IWSR | June 2026 | Global TBA volume, 2025–2035 | −1% cumulative, recovery beginning 2031; beer −1%, wine −14%, spirits −2%, RTDs +17% |
IWSR | June 2026 | US servings, 2025–2035 | −18%, alongside China at −19% among the steepest declines in any major market |
TD Securities | August 2026 | US supplier gross revenue, 2025–2030 | +1.3% CAGR, from per-capita volume −1.5% CAGR offset by +2.5% revenue per serving |
Silicon Valley Bank | January 2026 | US wine | Market bottoms 2027–2028, then modest growth; no V-shaped recovery |
Roland Berger | May 2026 | Global alcohol volume to 2050 | Worst case: volumes halve. Note this is the worst case, not the base case |
IWSR | January 2026 | No-alcohol analogues, 2024–2029 | +36% volume, exceeding 18 billion servings by 2029 |
IWSR | June 2026 | NA beer share of global beer | Doubles from 2% to 4% by 2033 |
Four implications worth planning around.
One: volume and value decouple, permanently. IWSR's US servings forecast of −18% by 2035 works out to roughly −1.8% a year. TD Securities' model of −1.5% per-capita volume against +2.5% revenue per serving lands in the same place on volume and disagrees only on whether pricing rescues the top line. The two houses are closer than the headlines suggest. Plan for fewer servings at higher value per serving, and stop treating case volume as the scoreboard.
Two: the global average hides where the volume actually leaves. Global volume is forecast down only 1% across the decade because India is projected up 38%, Colombia up 26% and Mexico up 13%. The US at −18% and China at −19% are carrying the decline. Any global-average number you see understates domestic pressure.
Three: wine has the structural problem, RTDs have the structural tailwind. IWSR's decade view has wine down 14% globally and RTDs up 17%. Globally, IWSR recorded wine volumes falling below spirits for the first time in 2025. In the US, Impact Databank projects the wine market to fall 3.5% in 2026, dropping below 300 million cases against a 2020 peak of 344 million and extending a multi-year run of volume decline. Rabobank frames the wine problem as oversupply and excess production capacity as much as lost demand, which points to consolidation rather than a demand-led recovery.
The wider category dynamics behind those forecasts, including RTDs and the premiumization reversal, are covered in our 2026 alcohol industry trends outlook.
Four: the alternatives keep growing, at maturing rates, and the biggest one is legally unstable. A no-alcohol category compounding at high-teens volume growth toward 18 billion servings by 2029 is a real business. A THC beverage category growing 135% into liquor stores is also real, and could lose most of its legal product inventory before Thanksgiving if Congress does not act. Those two lines should not be planned with the same confidence interval.
The honest counterargument
TD Securities published the most rigorous bull case on August 11, 2026, arguing structural alcohol risks are "overblown" and that current weakness reflects a cyclical reset from post-COVID normalization and macro pressure. Jefferies' Kaumil Gajrawala has been more direct in comments reported in June 2026, calling the beer decline "absolutely a cycle" and pointing to a roughly doubled share of consumers naming cost as a barrier since 2021. And there is a historical precedent worth remembering: the 1990s wine boom rested on cardioprotection research that has since been substantially questioned. Health messaging has moved this market in both directions before.
The case that this is structural rests on the health-perception data (51% of adults now say a daily drink or two is harmful, versus 27% in 2001, although that reading is flat against 53% in 2025), on the Annenberg finding that awareness of the alcohol-cancer link rose from 40% in September 2024 to 56% in February 2025 after the Surgeon General's advisory and was still at 53% a year later, and on the fact that awareness did not retreat even after the 2025–2030 Dietary Guidelines, published January 7, 2026, removed both the numeric daily limits and the cancer language.
A defensible planning stance sits between the two: treat roughly the affordability-attributed share as cyclical and recoverable, and treat the health-attributed and demographic share as permanent.

The shopper buying non-alcoholic is almost always buying alcohol in the same trip.
Part 6: What this means for your tier
For retailers. Your non-alcoholic set should be built for a shopper who is also buying alcohol in the same trip, because 92% of them are. Do not merchandise NA as a sobriety section. Watch the price ladder: with $100-plus spirits falling twice as fast as sub-$50, the premium end of your shelf is the one at risk, and the $20 to $30 tequila band is the one growing. If you carry hemp THC beverages, get your inventory position and your staff knowledge sorted before November 12.
For brands and suppliers. The motivational split is the strategy. Analogue products sell on health; adjacent functional products sell on curiosity and effect. Those are different packages, different claims, and different sets. Also note where the growth actually sits: spirits-based RTDs grew 16.4% in a category whose revenue fell 2.2%. Format innovation is outperforming liquid innovation.
Rebuilding a distributor and retail training program around a category that has changed this much is its own problem. We set out the playbook in how to build a beverage alcohol brand training program.
For distributors and reps. Your on-premise book is outperforming your off-premise book by roughly five points of volume, so lead with the accounts that are holding. Bring the operator a beverage program rather than a brand. SpotOn data showed independent restaurants adding 47% more non-alcoholic menu listings year over year as of January 2026, and trade reporting puts median mocktail pricing near $9 at the end of 2025, roughly double its 2020 level. Operators tell reporters the pour cost math on a well-built zero-proof drink competes with a $14 cocktail. Treat the margin claim as directional, since the published figures come from operator interviews and hospitality vendors rather than audited P&Ls, but the conversation is one your competitors are not having.
Whichever tier you sit in, the constraint is usually the same one: the person on the floor cannot explain a category they were never trained on. Our free alcohol training courses for retail teams, plus Functional Beverage Certified and Hemp Bev Certified, exist for exactly that gap.
Five things to watch before 2027
The House vote on the hemp delay. Default effective date November 12, 2026; Senate-passed delay would move most of it to December 11, 2026.
Whether NA growth holds at 20% or steps down again. The next Circana 52-week read is the tell.
Whether the on-premise advantage persists. SipSource's monthly narrowing has now run three consecutive months.
GLP-1 penetration. Gallup's series has run 3%, 8%, 11%. A fourth consecutive step-up changes the volume math.
State-level alcohol warning legislation. Alaska became the first state to require warning signage in bars and liquor stores when SB 15 became law in April 2025, and MultiState reports continued state-level activity into the 2026 sessions. No federal container warning has changed since 1988, and altering it would require Congress to amend the Alcoholic Beverage Labeling Act.
Frequently asked questions
What are people drinking instead of alcohol?
In order of how many occasions they absorb: ordinary soft drinks, coffee, tea and water first; then non-alcoholic beer, wine and spirits; then functional and adaptogenic drinks; then hemp-derived THC beverages. Among Dry January 2026 participants, CGA by NIQ found 57% ordered soft drinks and 41% ordered hot or iced drinks, while mocktails took 15% and alcohol-free beer 13%.
Why are Americans drinking less alcohol in 2026?
Four drivers, all documented in 2026 survey data, and no single one dominates: affordability, with more than a third of those drinking less naming higher prices as a key reason per Datassential; health perception, with 51% of adults now saying one or two daily drinks is bad for health per Gallup; demographic aging, with Boomers now the lowest-participating cohort per IWSR; and substitution into cannabis, functional drinks and non-alcoholic products.
Is alcohol consumption actually declining, or just shifting?
Both, unevenly. IWSR put US total beverage alcohol volume down 5% in 2025 with 49 of 50 states declining, so real volume left the market. But 92% of non-alcohol buyers still buy alcohol, and only 17% of US adults have used a non-alcoholic analogue in place of a drink in the past year. Most of the lost volume was not transferred to another category.
Is Gen Z really drinking less than older generations?
Less than the headlines claim. IWSR's July 2026 panel of more than 32,000 respondents put Gen Z legal-drinking-age participation at 74% across 15 markets, up from 66% three years ago, with Boomers lowest at 71%. Gallup's US figure for 18 to 34s is 50%, but Gallup measures any drinking among US adults while IWSR measures recent category consumption among legal-drinking-age consumers in 15 countries. Both show that frequency and drinks per occasion are falling faster than participation.
Is non-alcoholic beer actually growing?
Yes, and the rate is maturing. Circana put NA beer at $632.4 million in the 52 weeks ending April 19, 2026, up 22.0%. The Brewers Association, using NIQ all-channel data, puts NA at 2.5% of US beer volume in 2025, up from 1.1% in 2021. Analysts describe the category's growth rate stepping down from roughly 35% to roughly 20%.
Are THC drinks legal in my state?
It depends on your state and, as of late 2026, on Congress. Section 781 of Public Law 119-37, signed November 12, 2025, caps finished hemp-derived products at 0.4 mg of total THC per container effective November 12, 2026, which would make roughly 95% of current products federally unlawful. The Senate passed a partial delay to December 11, 2026 on August 8, 2026; the House had not acted as of publication. State rules vary widely, from Minnesota's 10 mg per container framework to California's total ban. See our hemp THC ban guide for current status.
Do GLP-1 drugs make people drink less?
The clinical evidence is strong in patients with alcohol use disorder and thinner in the general population. A 2026 Lancet trial of 108 adults with AUD and obesity found a 41.1% reduction in heavy drinking days on semaglutide plus CBT, 13.7 points better than placebo. Gallup put current US GLP-1 use for weight loss at 11% of adults in July 2026, up from 3% in 2024. The most-cited market-level model, Bernstein's from 2024, estimated a 2% reduction in US per-capita alcohol consumption by 2030 in the worst case.
What percentage of Americans do not drink?
About 46%, per Gallup's July 2026 survey, in which 54% of US adults said they drink alcohol.
Sources
Primary data cited in this article, in order of first appearance.
Gallup, "Americans' Drinking Remains at Record Low," August 20, 2026. https://news.gallup.com/poll/713534/americans-drinking-remains-record-low.aspx
IWSR, "Increased Gen Z drinking sustained as Boomers' drinking moderates," July 14, 2026. https://www.theiwsr.com/insight/press-release/increased-gen-z-drinking-sustained-boomers-drinking-moderates/
IWSR, "US beverage alcohol consumption drops -5% in volume during 2025," May 11, 2026. https://www.theiwsr.com/insight/press-release/us-beverage-alcohol-consumption-drops-5-in-volume-during-2025/
IWSR, "Global beverage alcohol to drop further before recovering," June 11, 2026. https://www.theiwsr.com/insight/press-release/global-beverage-alcohol-to-drop-further-before-recovering/
IWSR, "No-alcohol and functional drinks both booming but for different reasons," January 22, 2026. https://www.theiwsr.com/insight/press-release/no-alcohol-and-functional-drinks-both-booming-but-for-different-reasons/
Beer Institute, Taxable Removals Estimate Reports, February 13 and August 4, 2026. https://www.beerinstitute.org/data-economic/taxes-paid/
Distilled Spirits Council, Annual Economic Briefing, February 5, 2026. https://distilledspirits.org/news/annual-economic-briefing-2026/
WSWA SipSource, Q2 2026 depletion data, August 12, 2026. https://www.wswa.org/news/wine-and-spirits-declines-narrowed-third-straight-month-q2-2026-wswa-sipsourcer-data-shows
NIQ, "2025 Beverage Alcohol Year in Review," January 15, 2026. https://nielseniq.com/global/en/insights/analysis/2026/2025-beverage-alcohol-year-in-review/
NIQ, "Non-Alcohol Is No Longer a Niche," August 29, 2025. https://nielseniq.com/global/en/insights/report/2025/non-alcohol-is-no-longer-a-niche-its-a-billion-dollar-movement/
Brewers Association, "The State of Non-Alc," January 16, 2026. https://www.brewersassociation.org/insights/the-state-of-non-alc/
CGA by NIQ, "Dry January in the US On-Premise," January 13, 2026. https://nielseniq.com/global/en/insights/analysis/2026/dry-january-in-the-us-on-premise-how-beverage-brands-can-win/
Numerator, "Dry January 2026," January 22, 2026. https://www.numerator.com/resources/blog/dry-january-2026/
NIQ, "Buzz-Worthy: The High Rise of THC Beverages," April 2026. https://nielseniq.com/global/en/insights/infographic/2026/niq-perspective-buzz-worthy-the-high-rise-of-thc-beverages/
Brightfield Group, statement on the hemp-derived THC ban, November 14, 2025. https://blog.brightfieldgroup.com/brightfield-statement-on-hemp-derived-thc-ban
Calvert C. and Erickson D., "An Exploration of Supply-Side Effects of Recreational Cannabis Legalization," Journal of Cannabis Research, 2021. https://link.springer.com/article/10.1186/s42238-021-00085-x
Vicente LLP, "2026 Federal Hemp Ban," May 7, 2026. https://vicentellp.com/insights/2026-federal-hemp-ban-what-it-means-for-the-future-of-consumable-hemp-products/
CDC MMWR 75(11), kratom-related poison center reports, March 26, 2026. https://www.cdc.gov/mmwr/volumes/75/wr/mm7511a1.htm
Marijuana Moment on 2025 NSDUH daily-use data, July 28, 2026. https://www.marijuanamoment.net/daily-marijuana-use-now-outpaces-alcohol-drinking-and-cigarette-smoking-federal-report-shows/
Gallup, "GLP-1 Usage Reaches New High," July 7, 2026. https://news.gallup.com/poll/712157/glp-usage-reaches-new-high.aspx
NIH, "Adding weekly GLP-1 to cognitive behavioral therapy further reduces heavy drinking," April 30, 2026. https://www.nih.gov/news-events/news-releases/adding-weekly-glp-1-cognitive-behavioral-therapy-further-reduces-heavy-drinking
TD Securities, "Sober View Suggests Structural Alcohol Risks Are Overblown," August 11, 2026. https://www.tdsecurities.com/ca/en/sober-view-suggests-overblown-structural-alcohol-risks
Silicon Valley Bank, 25th Annual State of the US Wine Industry, January 15, 2026. https://www.svb.com/news/company-news/silicon-valley-bank-releases-25th-annual-state-of-the-us-wine-industry-report/
Roland Berger, "The Future of Alcohol," May 2026. https://www.rolandberger.com/en/Insights/Publications/The-future-of-alcohol-2026-industry-outlook.html
Annenberg Public Policy Center, awareness of the alcohol-cancer link, March 19, 2026. https://www.annenbergpublicpolicycenter.org/awareness-of-alcohol-cancer-link-holds-steady-despite-omission-in-new-u-s-dietary-guidelines/
Datassential, "Non-Alcoholic Beverage Trends 2026," January 16, 2026. https://datassential.com/resource/non-alcoholic-beverage-trends/
SpotOn, independent restaurant non-alcoholic menu data, March 18, 2026. https://www.businesswire.com/news/home/20260318465431/en/
The Spirits Business on SipSource price-tier data, "Depremiumisation hits US spirits sales," May 22, 2026. https://www.thespiritsbusiness.com/2026/05/depremiumisation-hits-us-spirits-sales/
Beverage Industry, "2026 State of the Beverage Industry: Beer Market Navigates Trends, Challenges," July 15, 2026. https://www.bevindustry.com/articles/98522-2026-state-of-the-beverage-industry-beer-market-navigates-trends-challenges
Beverage Industry, "2026 Beer Market Report: Moderation Trends Keep Non-Alcohol Growing," February 27, 2026. https://www.bevindustry.com/articles/98202-2026-beer-market-report-moderation-trends-keep-non-alcohol-growing
Brewbound, "Adult Non-Alc in 2026: A $1 Billion Category With a Splitting Playbook," August 13, 2026. https://www.brewbound.com/news/adult-non-alc-in-2026-a-1-billion-category-with-a-splitting-playbook
Beverage Industry, "2026 State of the Beverage Industry: Energy Drinks," July 10, 2026. https://www.bevindustry.com/articles/98511-2026-state-of-the-beverage-industry-energy-drinks-shots-market-embraces-innovation-functionality
Forbes, "THC Drinks Face A Federal Deadline," July 20, 2026. https://www.forbes.com/sites/noelburgess/2026/07/20/thc-drinks-federal-hemp-deadline-2026/
Circana, "Modern Soda's Moment," May 2025. https://www.circana.com/post/modern-soda-s-moment
PepsiCo, "PepsiCo Completes Acquisition of Poppi," May 19, 2025. https://www.prnewswire.com/news-releases/pepsico-completes-acquisition-of-poppi-accelerating-strategic-portfolio-transformation-302459040.html
NBC News, "Prebiotic soda brand Olipop valued at $1.85 billion," February 2025. https://www.nbcnews.com/business/business-news/prebiotic-soda-brand-olipop-valued-1point85-billion-latest-funding-rcna191894
Beverage-Digest, "Gut Soda Hiccup: Poppi Sales Fell in 2026 as Olipop Decelerated," August 5, 2026. https://www.beverage-digest.com/articles/1452-gut-soda-hiccup-poppi-sales-fell-in-2026-as-olipop-decelerated
DEA, "DEA to Temporarily Schedule 7-OH and Related Substances," July 1, 2026. https://www.dea.gov/press-releases/2026/07/01/dea-temporarily-schedule-7-oh-and-related-substances-protect-public
University at Buffalo, on Kruger et al., cannabis beverages and alcohol substitution, January 2026. https://www.buffalo.edu/news/releases/2026/01/krugers-cannabis-beverages.html
KFF Health Tracking Poll on GLP-1 use, November 14, 2025. https://www.kff.org/public-opinion/poll-1-in-8-adults-say-they-are-currently-taking-a-glp-1-drug-for-weight-loss-diabetes-or-another-condition-even-as-half-say-the-drugs-are-difficult-to-afford/
Brewbound on Bernstein's US alcohol consumption scenarios, February 21, 2024. https://www.brewbound.com/news/bernstein-is-us-alcohol-consumption-decline-a-temporary-blip-or-long-term-trend/
Rabobank, "Oversupply and excess production capacity create pressure for change," September 12, 2025. https://www.rabobank.com/knowledge/q011332979-beverage-market-buzz-oversupply-and-excess-production-capacity-create-pressure-for-change
Impact Databank via Shanken News Daily, US wine market projection, July 27, 2026. https://www.shankennewsdaily.com/2026/07/27/40437/exclusive-impact-databank-projects-u-s-wine-market-to-slip-3-5-in-2026/
Alaska Beacon on SB 15 alcohol warning signage, April 29, 2025. https://alaskabeacon.com/briefs/alaska-becomes-first-state-to-require-warnings-about-alcohol-cancer-link-under-new-law/
The Hill, "Senate tables hemp amendment at center of funding fight," August 8, 2026. https://thehill.com/policy/healthcare/6017926-senate-delays-hemp-thc-ban/
The Boston Globe, on mocktail pricing and menu economics, March 2026. https://www.bostonglobe.com/2026/03/20/business/boston-mocktails/
About the Author
Mathew Benoit leads content at Learn Brands, the training platform used by more than 90,000 people across 3,500 retailers and 350 beverage alcohol brands. Learn Brands builds product-knowledge and compliance courses for the three-tier system, including Hemp Bev Certified and Functional Beverage Certified, which gives our team a direct line of sight into what floor staff and distributor reps are being asked to sell and where their knowledge gaps are.
Methodology note. Every figure in this article is attributed to a named source with a publication date. Where two credible sources disagree, both are shown with an explanation of the methodological difference rather than an averaged number. Market-sizing estimates from syndicated SEO research vendors were excluded. Figures marked as forecasts are projections, not measured results.
Corrections and updates. Regulatory status on hemp-derived THC beverages is changing week to week. This article reflects the position as of August 21, 2026.

